 press-releases
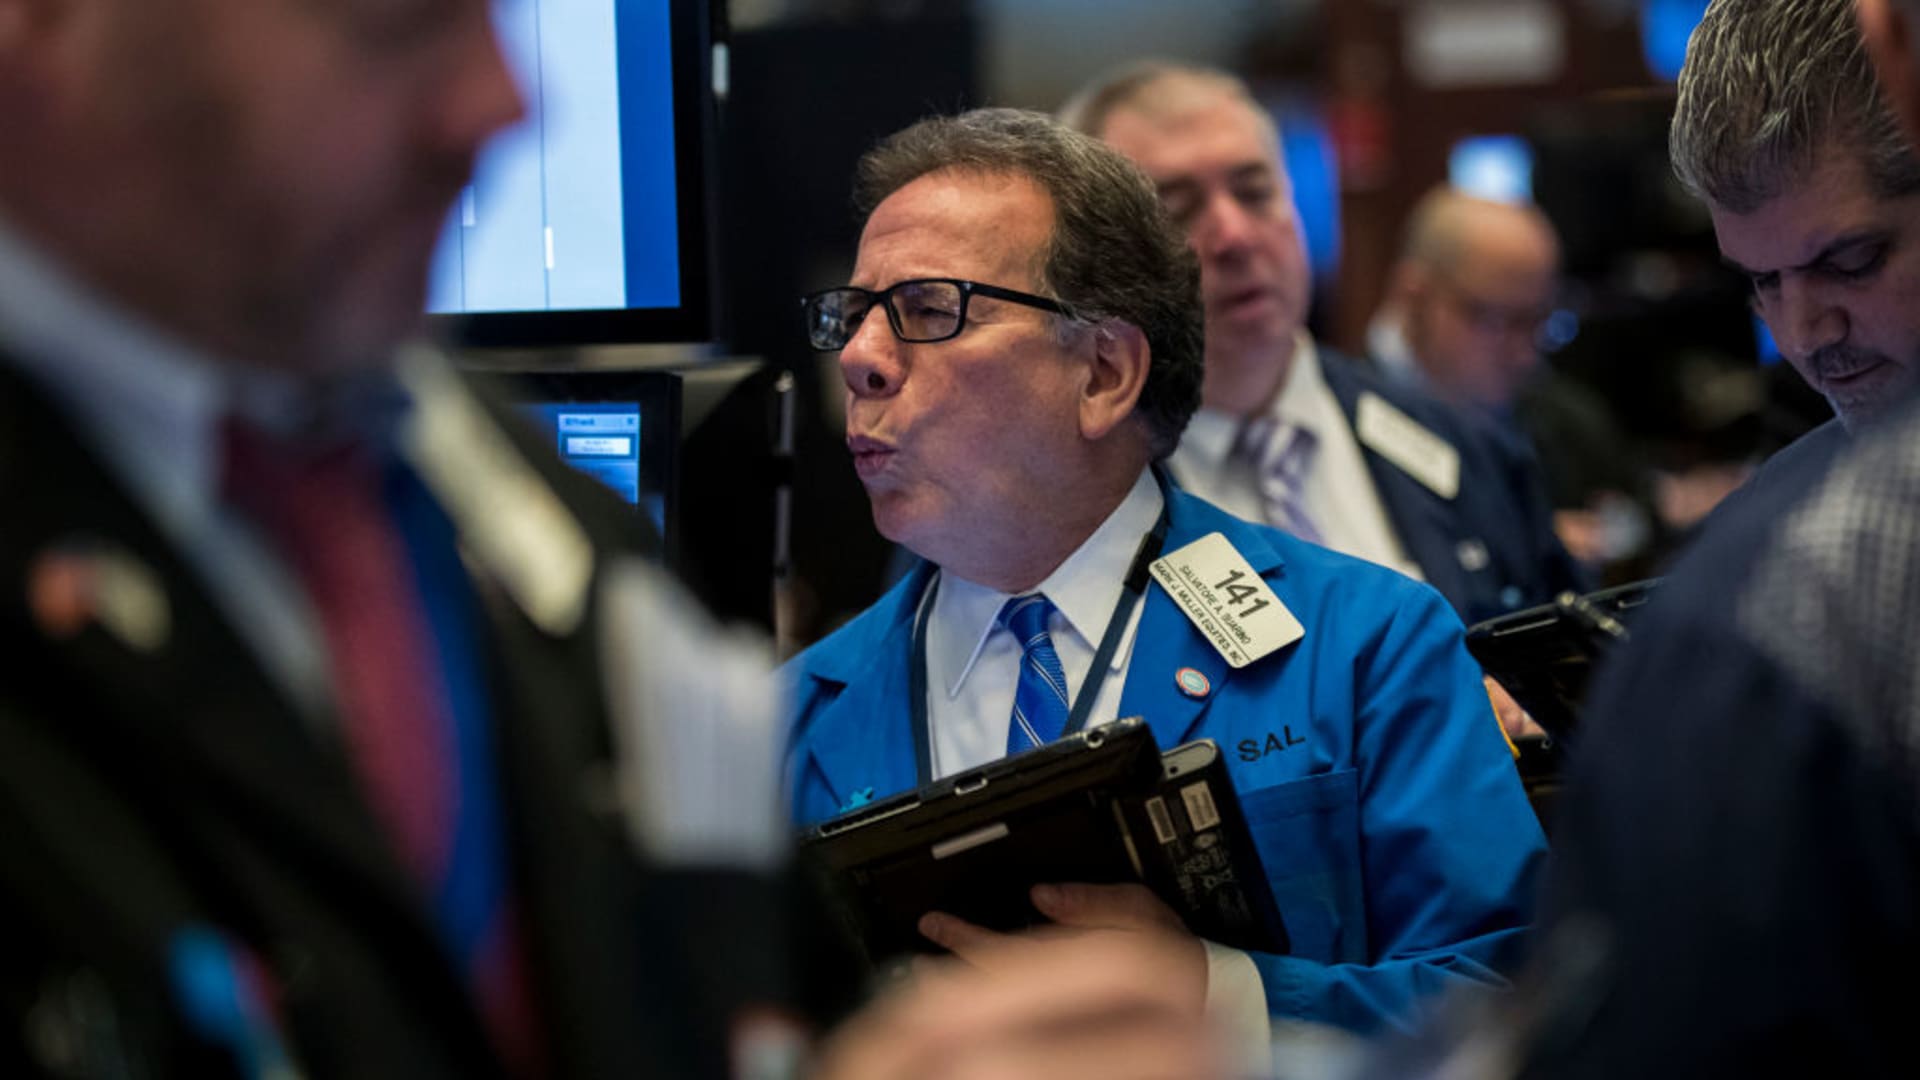
Drew Angerer | Getty Images News | Getty Images
A double bottom pattern is developing in the .
While that’s a bullish, dominant pattern in the index, its development is slow, indecisive and uncertain. That suggests it will run into strong resistance around the level of the double top pattern created in early 2018.
But rather than leading to a strong up trend breakout, the current reaction suggests the S&P index may become trapped in a long, slow sideways pattern with the market moving between 2,580 and 2,790.
That type of sideways pattern is good for traders as the market rallies and retreats within the confines of a broad trading band. It’s not so good, however, for long-term investors because the market returns are limited by the strong resistance level. Investors look for a good breakout above the upper resistance level near 2,790.
The current behavioral relationships in the Guppy Multiple Moving Average indicator suggest that a strong breakout has a low probability of developing.
The short-term group of averages used to track the inferred behavior of traders has shown some compression and expansion activity. However, this is not particularly strong. There is no great trading conviction in the rallies, nor in the retreats.
The long-term group of averages is used to infer the behavior and thinking of investors. The degree of separation in the long-term GMMA is an indication of the strength of the trend and the confidence level of investors. That is seen very clearly on the left side of the chart. Compare that to the degree of separation seen on the right side of the chart and it’s clear that investors have lost confidence in the market. The compression and clustering in the short-term group suggests market nervousness and a lack of commitment to a strongly developing uptrend.
This behavior confirms the potential to develop a sideways trading pattern in what becomes a directionless or moribund market.
That’s also confirmed by the reduction in volatility. The daily ranges in the index activity — low to high — are small and about the same size anytime in 2016 until Jan. 29, 2018. The general uptrend is not interrupted by days of significantly large daily ranges.
After February 2018, the market is dominated by large daily ranges. The daily range between the low and the high expands dramatically, but in recent weeks stability has returned to the index. The daily ranges have reduced and are now similar to the period prior to February.
The difference is that the reduction in daily ranges is not associated with strong and well-supported trend behavior. Instead they show a market that has slowed substantially.
Volatility, momentum and trending activity have declined. The breakout, below or above, the trading band will set the next trend direction. The critical question is how the index behaves as it approaches resistance near 2,790.
Trade war threats have not turned the uptrend into a downtrend, but they have neutered all trending activity.
Daryl Guppy is a trader and author of Trend Trading, The 36 Strategies of the Chinese for Financial Traders, which can be found at www.guppytraders.com. He is a regular guest on CNBC Asia Squawk Box. He is a speaker at trading conferences in China, Asia, Australia and Europe. He is a special consultant to AxiCorp.
For more insight from CNBC contributors, follow @CNBCopinion on Twitter.
24World Media does not take any responsibility of the information you see on this page. The content this page contains is from independent third-party content provider. If you have any concerns regarding the content, please free to write us here: contact@24worldmedia.com